Event: International Diabetes Federation (IDF) Congress, Abu Dhabi, UAE
Authors: P. Fogel, A. Civet, T. Fan, A. Shaunik, C. Brulle-Wohlhueter, Y. Gaston-Mathe
Background
Identifying categories of patients with diabetes sharing common characteristics and analysing clinical outcomes in these groups may lead to better understanding of patient diversity and generate hypotheses on disease-driving mechanisms.
The LixiLan-L trial (NCT02058160) studied the efficacy and safety of iGlarLixi
(lixisenatide and insulin glargine) versus insulin glargine (iGlar) alone in 736 patients with type 2 diabetes (T2D) inadequately controlled with basal insulin.
The superiority of iGlarLixi versus iGlar in improving HbA1c was demonstrated.
Currently, both clinical practice and clinical trials, including LixiLan-L, focus on glucose levels (such as glycated haemoglobin [HbA1c] and fasting plasma glucose [FPG]) to direct therapy choice and treatment titration for patients with T2D.
Methods
PosNeg NMF, a factorial analysis method, was used to describe 226 baseline characteristic variables (demography, vital signs, glycaemia, biology, quality of life) of 728 LixiLan-L patients in terms of a small number of NMF components aggregating several baseline characteristics variables.
PosNeg NMF is a variant of NMF that improves clustering by giving as much importance to lower values as to higher values2
PosNeg NMF assumes the end-of-study (EoS) outcome being observed is actually a mixture of different components where each component has a different response pattern; each sample is a weighted sum of parts (component score = how much of a component is there in a given sample; component loading = how much does a given variable [baseline characteristic] contribute to the component response [EoS outcome] pattern).
NMF component loadings can be seen as “archetypal patients”; each patient can then
be analysed by the importance of each NMF archetype.
NMF component scores provide an interesting decomposition of the original baseline characteristic variables and a robust clustering of patients.
Clusters were formed according to their relative high or low baseline characteristic values and visualized using a heatmap where their stability and leverage were confirmed as described previously 2
Results
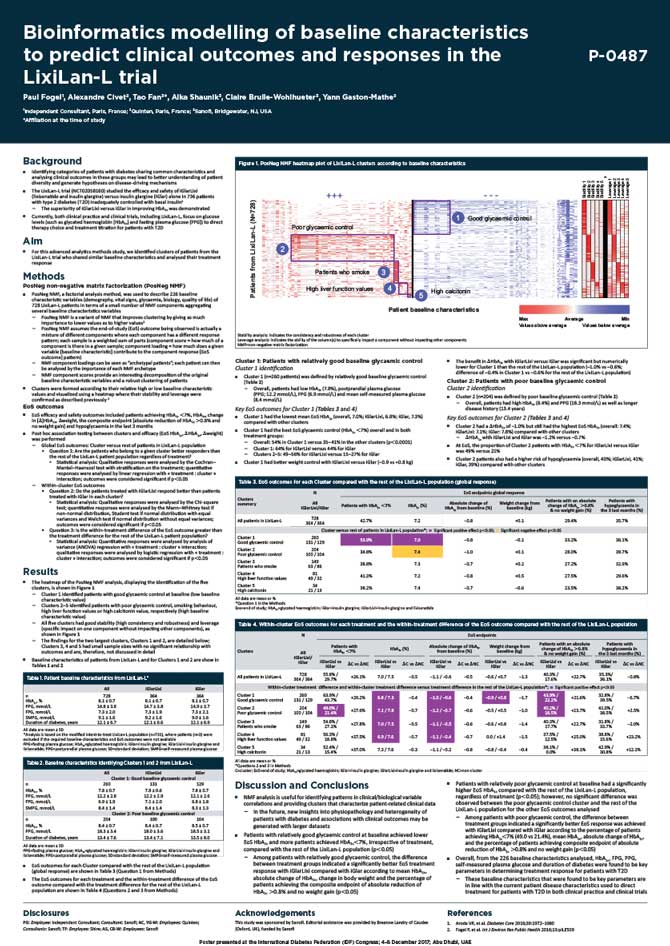
The heatmap of the PosNeg NMF analysis, displaying the identification of the five clusters, is shown in Figure 1.
Cluster 1 identified patients with good glycaemic control at baseline (low baseline characteristic value).
Clusters 2–5 identified patients with poor glycaemic control, smoking behaviour, high liver function values or high calcitonin value, respectively (high baseline
characteristic value).
All five clusters had good stability (high consistency and robustness) and leverage (specific impact on one component without impacting other components), as shown in Figure 1.
The findings for the two largest clusters, Clusters 1 and 2, are detailed below.
Clusters 3, 4 and 5 had small sample sizes with no significant relationship with outcomes and are, therefore, not discussed in detail.